


MapToPoster: urban cartography turned into reproducible posters
originalankur/maptoposter · 14,153★ · 1,259 forks
Everything worth knowing about originalankur/maptoposter: a Python tool that pulls the road network and other OpenStreetMap layers to render city posters from the command line.
What MapToPoster is
MapToPoster turns a city and country into a minimalist cartographic poster. The project combines geocoding, OpenStreetMap data, and Matplotlib rendering; the result is saved as an image in posters/. The repository presents itself as a programmable generator, not a hosted service or an official GUI app.
Its practical pitch is that the same command, theme, and radius produce a repeatable composition. It includes 17 themes, road hierarchies, water, parks, typography, and support for non-Latin script labels.
The origin: a fast launch with immediate attention
The repository was created on January 8, 2026 by Ankur Gupta (originalankur), whose public profile lists Bengaluru and links to ankur.dev. The project’s history pins the first version, 0.1.0, to January 17, 2026, with 17 themes and the basic city/country flow; the same day it was also tagged v0.2.
The post “Map To Poster – Create Art of your favourite city” hit Hacker News on January 17, 2026. It reached 296 points and 70 comments, notable early attention for a freshly created repository. The reception also revealed the project’s central tension: producing attractive images from public geographic data is simple through the interface, but geocoding, projection, and data-volume limits show up once you want precision or a large city.
Philosophy and principles
- Code before interface: the maintainer asks not to submit web or desktop interfaces for now, and not to add Docker; the expected core is the command-line tool.
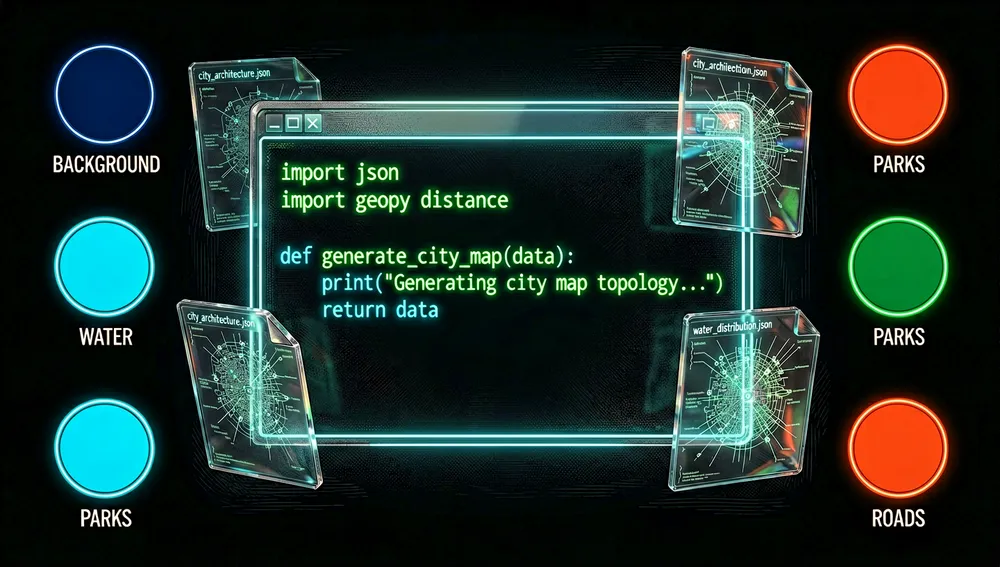
- Declarative customization: themes are defined as JSON files in
themes/, with colors for background, text, water, parks, and road categories. - Open data, visual output: the pipeline uses Nominatim for geocoding, OSMnx for retrieving the data, and Matplotlib for rendering.
- Verifiable result: the contributor guide asks that any fix be visually tested and the poster compared before and after.
How it works
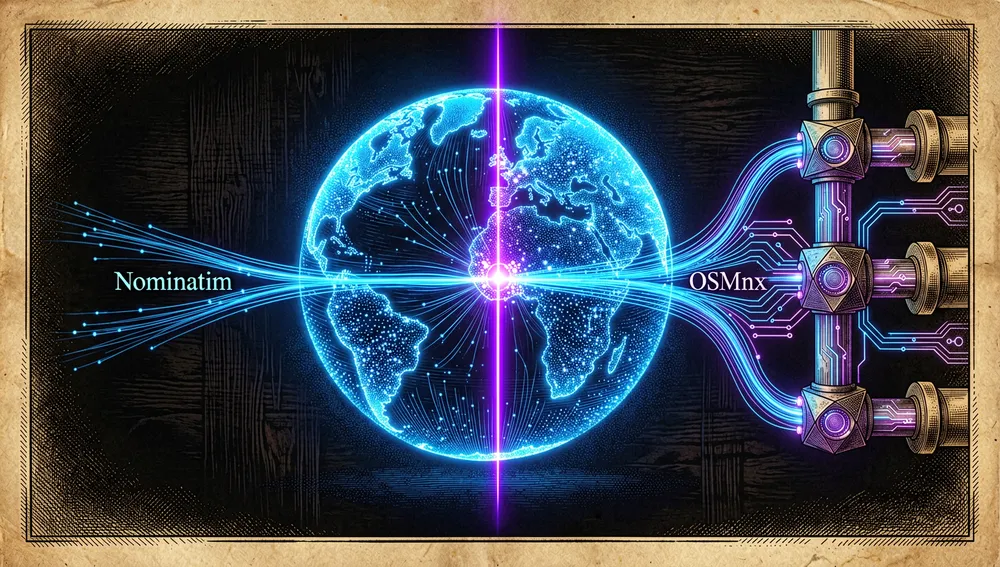
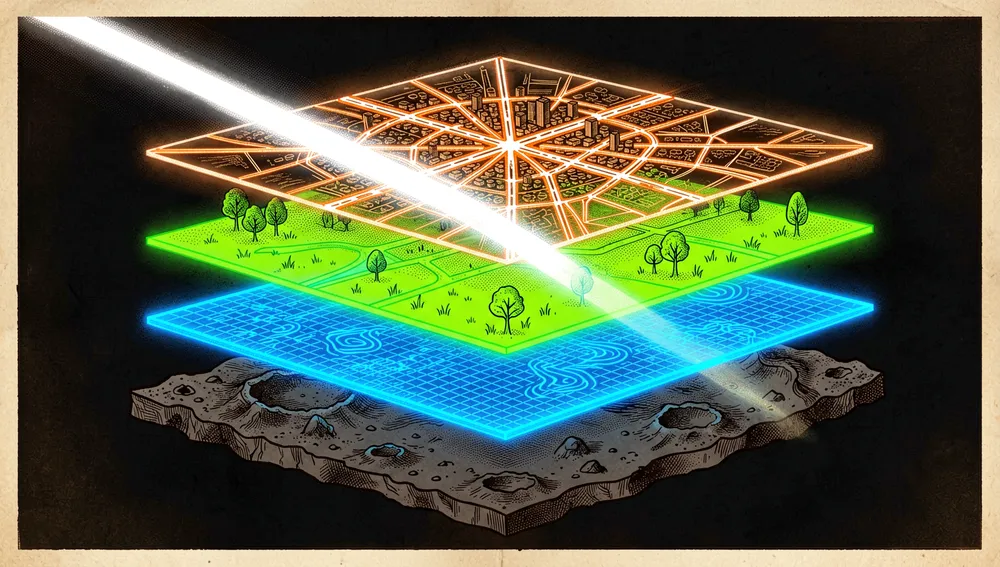
The program parses arguments, resolves the city into coordinates with Nominatim, downloads the network and layers from OpenStreetMap via OSMnx, and draws them with Matplotlib. The documented order stacks background, water, parks, roads, gradients, and finally labels; roads get their width and color from OSM’s highway category.
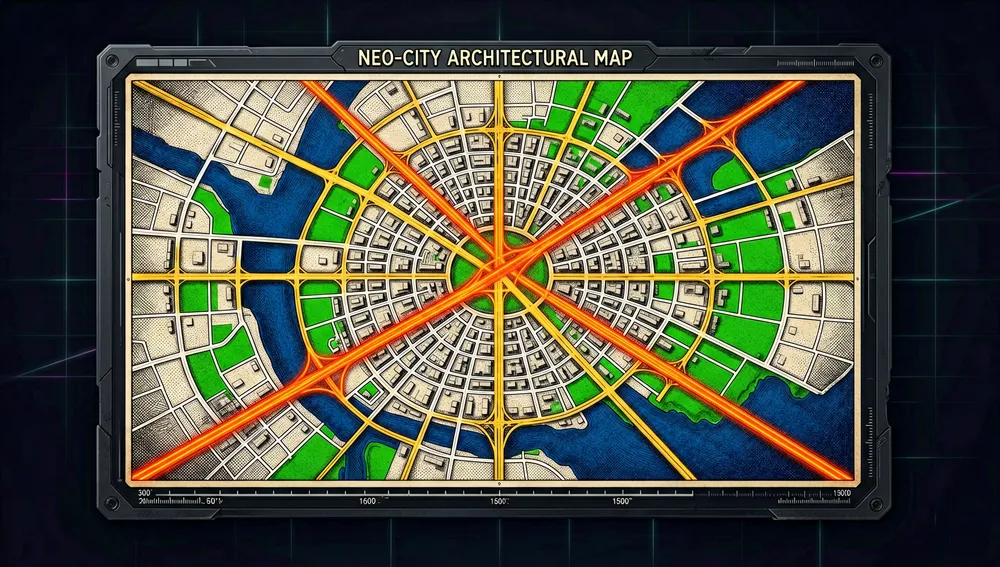
The tool supports a radius in meters, an explicit center via latitude/longitude, a physical size in inches, a single theme, or all themes. For international text, it can separate the name used for geocoding from the text displayed on the poster, and download a Google Fonts family into fonts/cache/.
The changelog credits version 0.2.1 with local OSM data caching, a 0.3-second pause between requests, projection fixes, and a 10-second Nominatim timeout. The branch without a formally published version adds uv support, Python 3.11 or later, and coordinate overrides.
Official and semi-official status
No evidence was retrieved of acceptance into an official marketplace, endorsement from a mapping vendor, or an official registry package during this research. GitHub’s homepage field is empty, so the repository and its README are the retrievable canonical documentation.
In practice it’s a community open-source project under the MIT license, with Discussions, issues, and pull requests enabled; its numerous forks and adaptations do not amount to official certification.
The ecosystem
Derivatives, ports, and interfaces
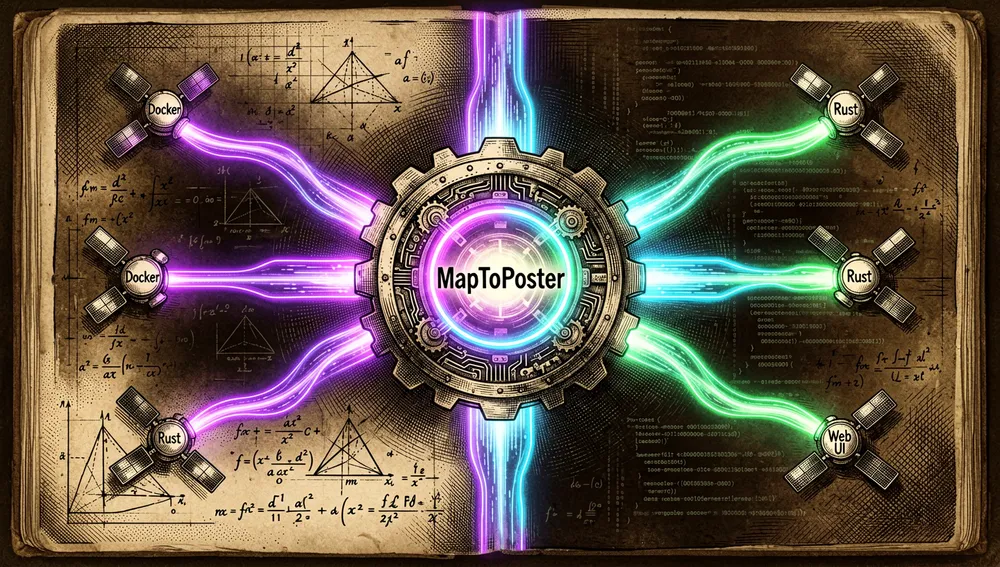
cedgeek/maptoposter-dockeris a fork detected via the API and announces a Docker variant: 26 stars and 5 forks. It’s a community adaptation, even though the main project doesn’t accept Docker for now.rramboer/OpenCartographis another fork from the API; it’s renamed as a cartography generator, with 4 stars and 3 forks.frohman04/maptoposter-rsdescribes itself as a Rust version of MapToPoster; andfezcode/CartoGoclaims to seek aesthetic parity with the original generator, from Go. Both are ports declared by their own authors, not official components.simongrossi/maptoposter-web,s4chdev/maptoposter-webui, andmsamuslim101/maptoposterguidescribe themselves as web or desktop layers built on top of the original idea or script. The main README’s explicit restriction rules out presenting them as accepted extensions.ianho7/maptoposter-onlineis an adjacent online app with 891 stars;dimartarmizi/map-to-posteris a client-side web app with 1,050 stars, themes, layouts, and export. The search returns them as related, but not as official GitHub forks.
No complete community translation of the repository was identified. Internationalization does exist in the product itself: the README shows examples in Japanese, Korean, Arabic, Chinese, Thai, and Khmer via display names and appropriate fonts.
Comparable projects
| Project | Verifiable relationship |
|---|---|
anvaka/city-roads | Visualizes a city’s roads; focused on that one layer, while MapToPoster composes a poster with themes and labels. |
yousifamanuel/terraink | Presents itself as a customizable cartographic poster engine. |
chrieke/prettymapp | A Streamlit app for creating artistic maps from OSM data. |
koenderks/rcityviews | An R and Shiny package for stylized urban maps. |
dimartarmizi/map-to-poster | A client-side web alternative for location posters. |
The repositories and descriptions in this table were retrieved from GitHub searches; no compatibility, affiliation, or independent comparative evaluation is claimed.
Repo numbers
Measured: August 9, 2026, GitHub API.
| Metric | Value |
|---|---|
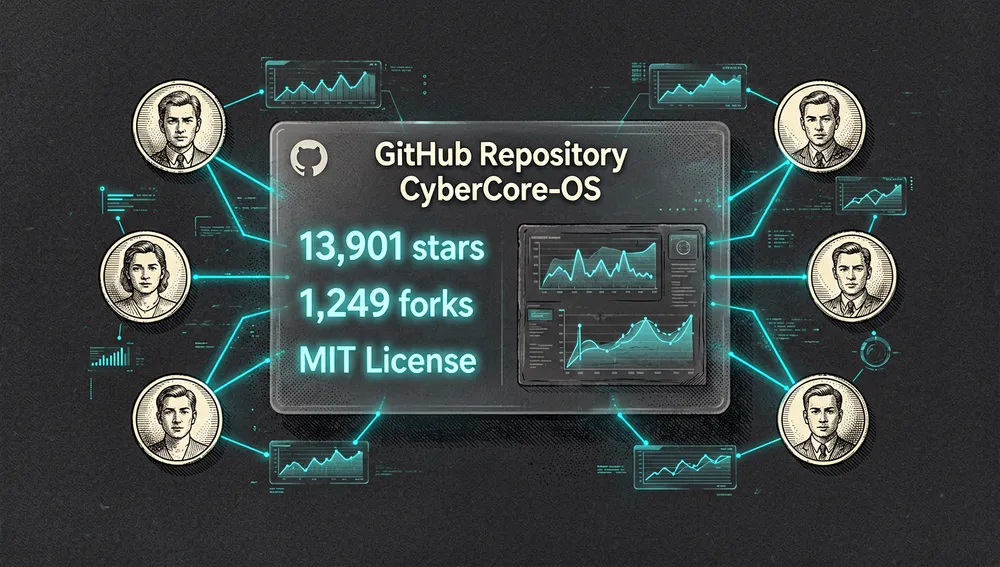
| Stars | 13,901 |
| Forks | 1,249 |
| Real subscribers | 45 |
| Contributors returned by the API | 16 |
| Open issues reported by the API | 63 |
| Primary language | Python |
| License | MIT |
| Created | January 8, 2026 |
| Last recorded push | August 6, 2026 |
| Last metadata update | August 9, 2026 |
| Latest changelog version | 0.3.0, January 27, 2026 |
| Formal GitHub releases | none; there is a v0.2 tag |

The top contributors in the API result are originalankur (17 contributions), lorenzofratus (9), and Saibamen (4). GitHub’s open_issues_count field can include open pull requests; it should not be read as an issues-only count. watchers_count duplicates the star count in that response, which is why subscribers_count is used for the 45 real subscribers.
How to contribute
No CONTRIBUTING.md was retrieved at the root; the guidance lives in the README. It accepts bug fixes, requires visually testing the result before and after, and asks that Discussions or Issues be consulted before undertaking a large feature. It also sets as current limits: no web/desktop UI and no Docker.
The tree contains test/, and the changelog notes pull-request checks via GitHub Actions since 0.3.0.
Discussions, issues, and pull requests are visible, so the practical flow is to propose the change in the repository’s channels, implement it in a fork, and open a pull request with visual evidence.
How the community received it
The Hacker News thread 46656834 got 296 points and 70 comments. User stephenlf praised the results and called the README a great-quality example for open source; that’s an individual opinion, not proof of general quality. mft_ asked for SVG output, while Helmut10001 flagged possible projection issues in samples. Kwpolska and mvdwoord requested manual coordinates and mentioned geocoding difficulties; Footprint0521 reported extreme slowness generating PDF/SVG for a large city. These objections line up with the coordinate, cache, and projection controls added later in the changelog.
As external practical material, a video from Blueprint Bytes, “How to Create Custom Map Posters with Mapbox and Python: maptoposter Guide,” was retrieved: 4 minutes 45 seconds, published on January 24, 2026, with 610 views at the time of the query. It’s an independent tutorial; its existence doesn’t constitute a technical audit.
No retrievable evidence was obtained from Reddit due to a site challenge, nor from X since it requires authentication. Product Hunt showed an anti-bot check; DEV returned an empty list for the maptoposter tag, Hashnode showed no posts in its search, and iTunes returned no exact episodes. These limitations don’t prove an absence of conversation on those platforms.
Quick-start guide
Installation and first run
Python 3.11 or later is required for the current project. The recommended path is installing uv and running from the clone:
uv run ./create_map_poster.py --city "Paris" --country "France"On first use, uv run creates and manages the environment and installs dependencies. As a reproducible alternative, run uv sync --locked before the same command. With pip, create and activate .venv, install requirements.txt, and run python create_map_poster.py .... The first result is saved to posters/{city}_{theme}_{YYYYMMDD_HHMMSS}.png.
Common workflows
# Generate a poster with the default theme.
python create_map_poster.py -c "Paris" -C "France"

# Adjust composition and theme for a specific area.
python create_map_poster.py -c "Barcelona" -C "Spain" -t warm_beige -d 8000

# Fix ambiguous geocoding with an explicit center.
python create_map_poster.py --city "New York" --country "USA" -lat 40.776676 -long -73.971321 -t noir

# Browse or render all the visual options.
python create_map_poster.py --list-themes
python create_map_poster.py -c "Tokyo" -C "Japan" --all-themes
Essential configuration
--cityand--country: required, used for geocoding.--themeandthemes/*.json: pick a style or let you create one with colors for layers and roads.--distance: controls the radius, defaulting to 18,000 m; the README suggests 4–6 km for small, dense areas, 8–12 km for city centers, and 15–20 km for metropolitan areas.--widthand--height: measured in inches, with a maximum of 20; they help target print or screen resolution.--display-city,--display-country, and--font-family: enable local labels and download/cache the font intofonts/cache/.
Common pitfalls and fixes
- Wrong city or an unhelpful center: keep city and country for the labels, but combine
--latitudeand--longitudeto pin the center. The changelog notes this feature exists specifically for precise control. - Slow rendering or memory use: the README warns that radii above 20 km mean slower downloads and more memory. Reduce
--distance, usenetwork_type='drive'when editing the code for quick previews, and drop the DPI from 300 to 150 for previews. - Geocoding limits: the guide recommends local coordinate caching to avoid Nominatim limits; the project already applies OSM data caching and a pause between requests.
- Layers hiding roads: the changelog logs a layer-order fix so roads sit above water and parks. Update to the current code if that bug shows up on an older checkout.
Integrations and migration
Native integration is with OpenStreetMap data via OSMnx, Nominatim geocoding, Matplotlib, and Google Fonts; no official integration with MCP, editors, CI, or messaging is documented.
For a containerized deployment or an interface, the community forks and interfaces in the ecosystem are starting points, but the main maintainer doesn’t accept them as contributions.
Use cases and who this repository can help
- Designers, cartographers, and people preparing prints or wallpapers can generate the same city with an explicit radius, theme, and size, and get PNG files with a traceable name in
posters/. - Anyone who needs local labels or samples for international cities can keep the search name in Latin script while displaying Japanese, Arabic, Chinese, Korean, Thai, or Khmer with an appropriate font.
- Developers exploring OpenStreetMap data can modify the theme JSON files, the
create_poster()layers, or the road hierarchy to add their own visualization, backed by documented architecture and key functions. - Teams that need a web app, Docker, or a production pipeline should evaluate the community adaptations or comparable projects first: those uses fall outside the contribution scope accepted by the main repository.

Resources
- Repository: https://github.com/originalankur/maptoposter
- Documentation and setup: https://github.com/originalankur/maptoposter#readme
- Changelog: https://github.com/originalankur/maptoposter/blob/main/CHANGELOG.md
- Community and contributions: https://github.com/originalankur/maptoposter/discussions, https://github.com/originalankur/maptoposter/issues, https://github.com/originalankur/maptoposter/pulls
- Review and conversation: https://news.ycombinator.com/item?id=46656834
- Video tutorial: https://www.youtube.com/watch?v=8vBIeVSLzzI
- Releases and tag: https://github.com/originalankur/maptoposter/releases, https://github.com/originalankur/maptoposter/tags
Note: this article combines documentation, changelog, and the GitHub API, plus community sources retrieved on August 9, 2026. Figures change over time.


Comments