

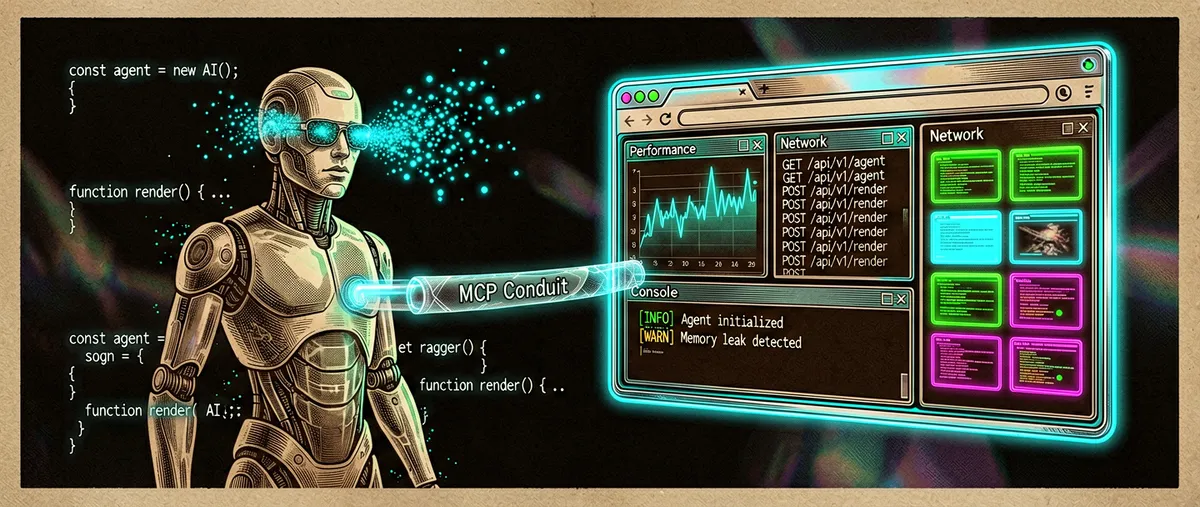
chrome-devtools-mcp: the official server that gives AI agents browser eyes
ChromeDevTools/chrome-devtools-mcp · 52,594★ · 4,695 forks
“Chrome DevTools for coding agents” — the official Chrome DevTools MCP (Model Context Protocol) server that lets AI agents debug, inspect, and audit web pages directly in the browser, instead of “coding blindfolded.”
Data status: verified September 11, 2026 from the GitHub API, the npm registry, Hacker News (Algolia), the official developer.chrome.com blog, and the repository code (
mainbranch).
What it is
chrome-devtools-mcp is an MCP server, written in TypeScript and licensed under Apache-2.0, that exposes Chrome DevTools capabilities as tools an AI agent (Claude Code, Codex, Gemini CLI, Cursor, VS Code Copilot, etc.) can call. The problem it solves is stated explicitly in the launch announcement: coding agents “aren’t able to see what the code they generate actually does when it runs in the browser” — they’re “effectively coding blindfolded.” With this server, the agent can open the page, capture performance traces, read the console, inspect network requests, click, fill forms, and take screenshots, then use that feedback to fix its own code.
In practice, the chrome-devtools-mcp npm package includes two surfaces: the MCP server (the main use case), which connects to an MCP client via stdio; and an experimental CLI (chrome-devtools) bundled in the same package, which acts as a client for a background daemon. This is notable because, per Paul Irish (see reception), it was born precisely as a response to MCP’s token costs.
It’s not an automation framework that launches an isolated browser: its distinguishing feature is that it connects to the Chrome you’re already running (or an existing browser via --browser-url), preserving the session, cookies, and authentication.
Origin
Creators / maintenance: the team behind Chrome DevTools and Puppeteer, at Google. Paul Irish (a former DevTools team member, and per his own account on Hacker News, still one) confirmed and publicly defended it. Launch: on September 23, 2025 it was published as a public preview via a post on the official Chrome blog: “Chrome DevTools (MCP) for your AI agent” (developer.chrome.com/blog/chrome-devtools-mcp). Repository creation date: September 11, 2025.
The announcement was presented as a direct response to the “blind” agent problem. The post’s tone was practical demonstration with example prompts (“Verify in the browser that your change works,” “Why aren’t some images loading on localhost:8080?”, “Localhost:8080 loads slowly, make it load faster”). The team stated it would build the project “incrementally” and asked for public feedback on what capabilities to add next.
Fun community fact: Paul Irish revealed on Hacker News (2026) that the standalone CLI had “just landed” and hadn’t been officially announced yet, warning: “Good news for everyone conscious of MCP’s outrageous token costs! The CLI hasn’t been announced yet (sorry folks), but it’s shipping in the latest v0.20.0 release.”
Philosophy and principles
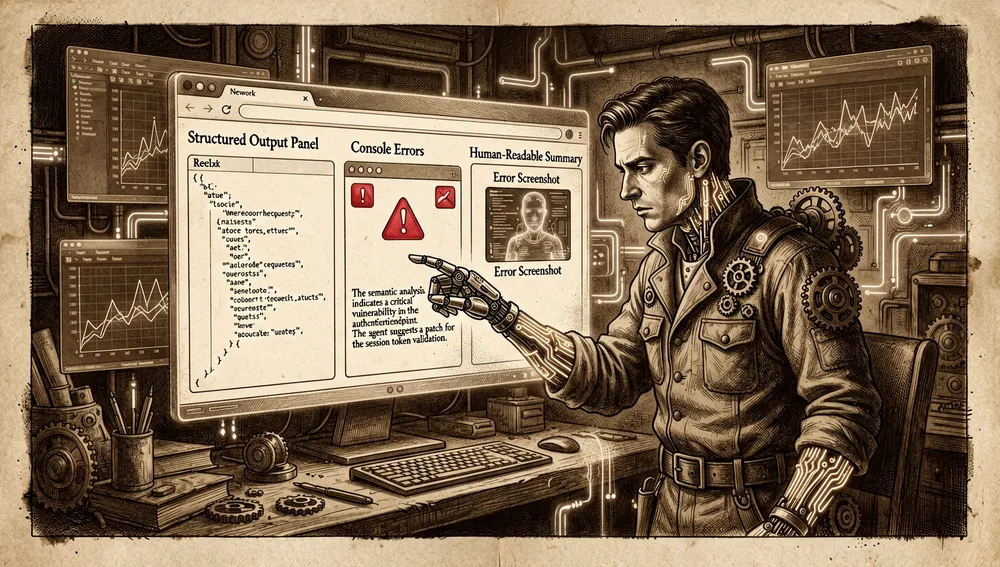
The repository documents its design principles in docs/design-principles.md. They’re “rough” guidelines applied “with nuance”: agent-agnostic API (use standards like MCP; don’t lock into one LLM); token-optimized (return semantic summaries: “LCP was 3.2s” beats 50,000 lines of JSON; files are the right place for large data volumes); small, deterministic building blocks (give the agent composable tools — Click, Screenshot — not “magic buttons”); self-recoverable errors (return actionable errors with context and possible fixes); human-agent collaboration (output should be readable by machines and by humans); progressive complexity (tools simple by default, with optional advanced arguments for experienced users); and reference over value (for heavy assets, return a file path or URI, never the raw data stream).
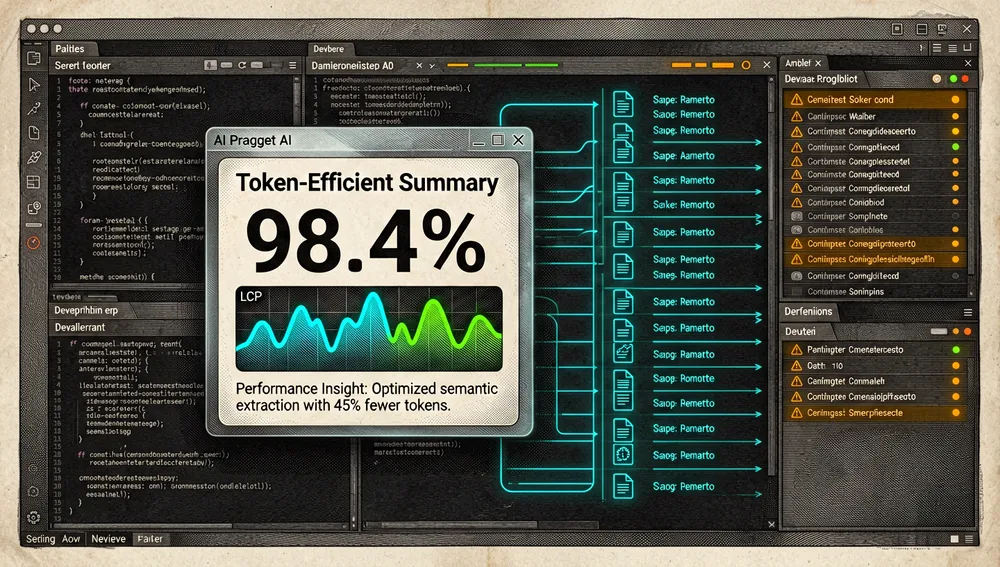
These principles explain the recurring Hacker News debate about token consumption: the team wants to be efficient, but the nature of browser state makes the data volume intrinsically high.
How it works
Architecture
MCP server mode: the MCP client (Claude Code, Codex, etc.) launches npx -y chrome-devtools-mcp@latest over stdio. The server opens or connects to Chrome and exposes the tools.
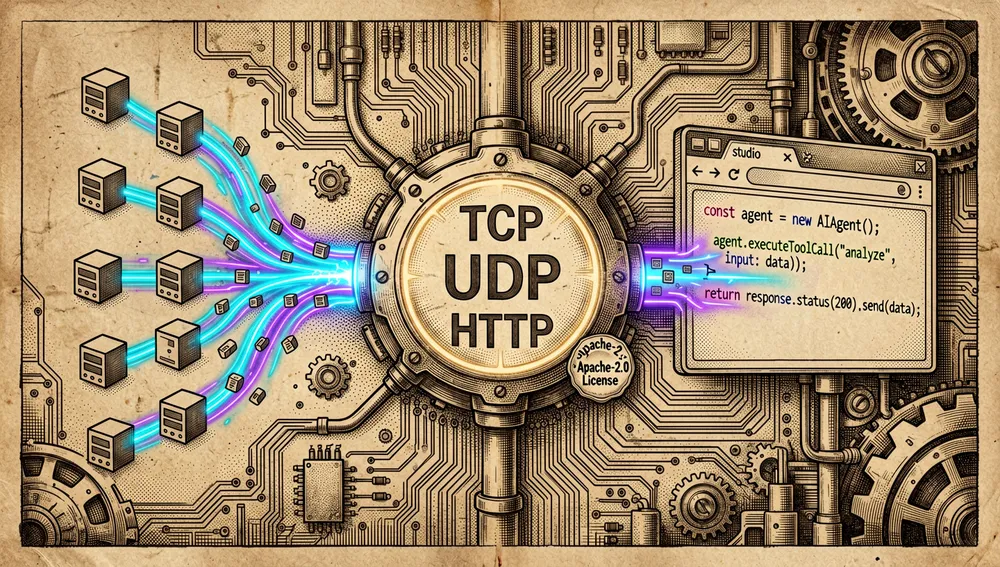
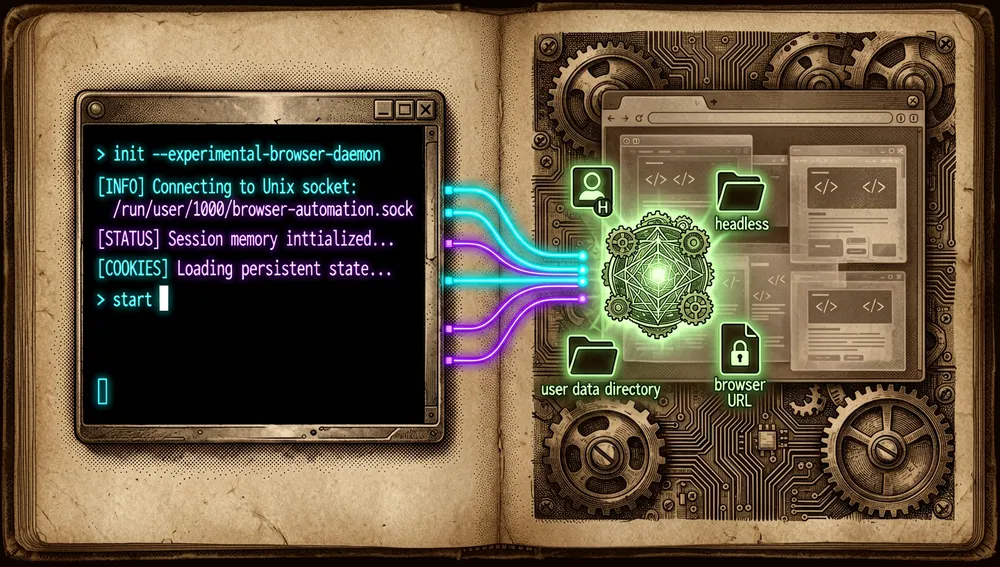
CLI mode (chrome-devtools): the CLI is a client for a background daemon that uses UNIX sockets on Linux/Mac and named pipes on Windows. Documented behavior: auto-start (the first time you call a tool, the CLI starts the MCP server and browser in the background if they’re not running); persistence (the same background instance is reused across successive commands, preserving browser state); and manual control (start, stop, and status manage the process; start forwards arguments like --headless or --userDataDir, though not all are supported). Headless is on by default; isolated too, unless --userDataDir is passed.
Tools (catalog sample)
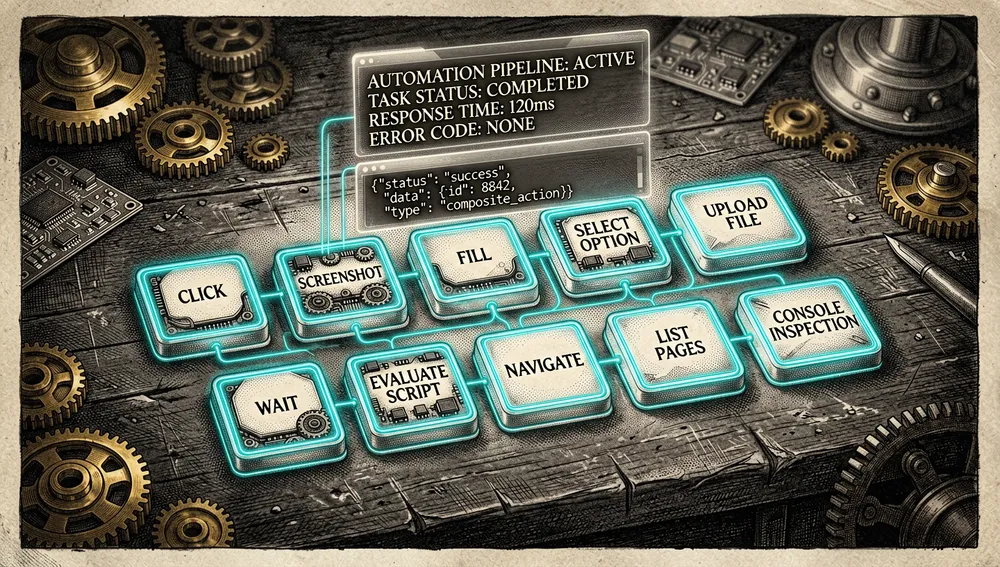
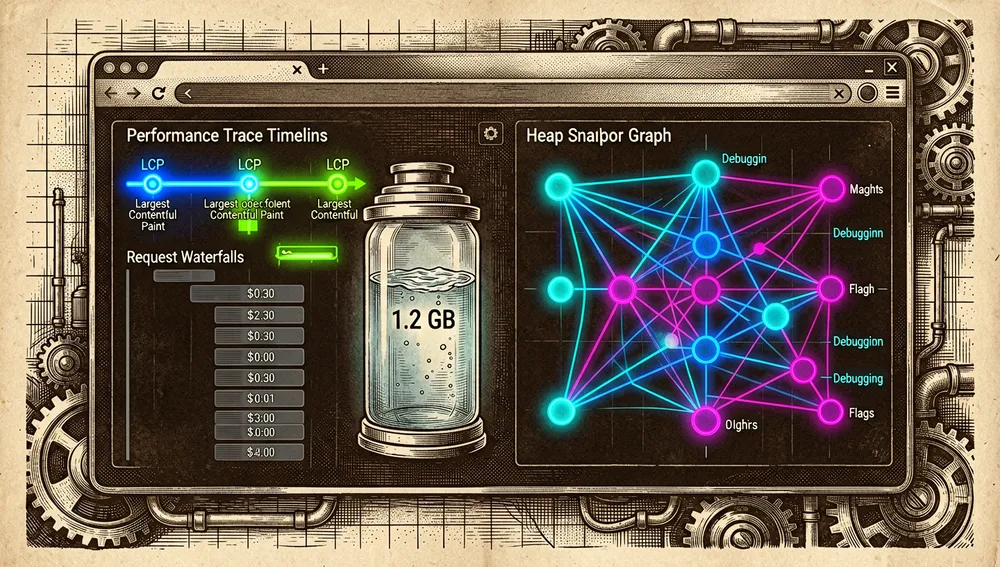
The repository maintains an extensive tool-reference.md (~25,000 characters). Among the tools verified in the documentation and changelog: pages/navigation (list_pages, new_page, navigate_page, take_screenshot, click, fill, select_option, upload_file with multi-file support since v1.8.0, wait_for, evaluate_script); network (request inspection with truncated URLs in “concise” output since v1.9.0, and per-navigation retention limits since v1.7.0); console (list_console_messages, with optional stack traces since v1.8.0); performance (performance_start_trace, with a default DevTools-aligned 1.2 GB trace buffer since v1.9.0, and metric analysis like LCP); memory (needs --memoryDebugging: get_heapsnapshot_summary, get_heapsnapshot_edges, query_heapsnapshot, get_heapsnapshot_object_details, a suite added between v1.7.0 and v1.8.0); emulation (emulate, with input validation since v1.9.0); PWA (tools added in v1.8.0); and screencast (FPS option added in v1.9.0).
Common flags / command patterns
--browser-url=<url> (connect to an already-running browser, e.g. Antigravity’s on port 9222); --workspace=<dir> (repeatable; limit file tools to specific directories, not combinable with --allow-unrestricted-paths); --headless, --userDataDir, --screenshotFormat, --no-javascript-evaluation (which since v1.9.0 also covers navigations and initScripts); --memoryDebugging (enables memory tools); and --allow-unrestricted-paths (on by default in the CLI since v1.9.0).
The ecosystem
Same authors / official org (ChromeDevTools): chrome-devtools-mcp itself includes a plugin marketplace for Claude Code (/plugin marketplace add ChromeDevTools/chrome-devtools-mcp) that bundles the MCP server plus skills (v1.9.0 added the “Agent Plugins 1.0 package”). There’s also a Gemini extension package (gemini extensions install ... https://github.com/ChromeDevTools/chrome-devtools-mcp) combining MCP + skills.
Browser automation projects for agents (competitors/complements named on Hacker News): vercel-labs/agent-browser — “Browser automation CLI for AI agents” — 42,416 stars, 2,831 forks (created January 11, 2026); an HN user (NiekvdMaas) noted it works well alongside DevTools MCP using --auto-connect. remorses/playwriter — “Chrome extension & CLI to let agents control your browser” — 3,879 stars, 178 forks (created November 13, 2025); recommended in the main HN thread (zxspectrumk48) as an alternative that “connects to the existing session.” pasky/chrome-cdp-skill — an agent skill for CDP, mentioned by aadishv on the HN thread (daily use with Codex to manage a local music library).
CDP/debugging alternatives: ScriptedAlchemy/devtools-debugger-mcp — “MCP server exposing full Chrome DevTools Protocol debugging: breakpoints, step/run, call…” — 347 stars. williamkapke/kapture — “Chrome DevTools Extension that enables browser automation through MCP” — 183 stars. benjaminr/chrome-devtools-mcp — “An MCP Server for Chrome DevTools, following the Chrome DevTools Protocol” — 308 stars (same name as the official one; not from the Chrome team).
Paul Irish warned on HN that “browser automation + agents is a very busy space with a lot of parallel efforts,” and clarified that pasky/chrome-cdp-skill is an independent project, not a DevTools MCP skill.
Official / semi-official status
Official from Google / the Chrome DevTools and Puppeteer team: the project is maintained by the Chrome DevTools team itself. It launched as an official public preview (September 23, 2025) from the developer.chrome.com blog, Chrome’s official documentation domain. This positions it as the de facto reference for browser debugging by agents using Chrome: it’s the implementation “from the source.”
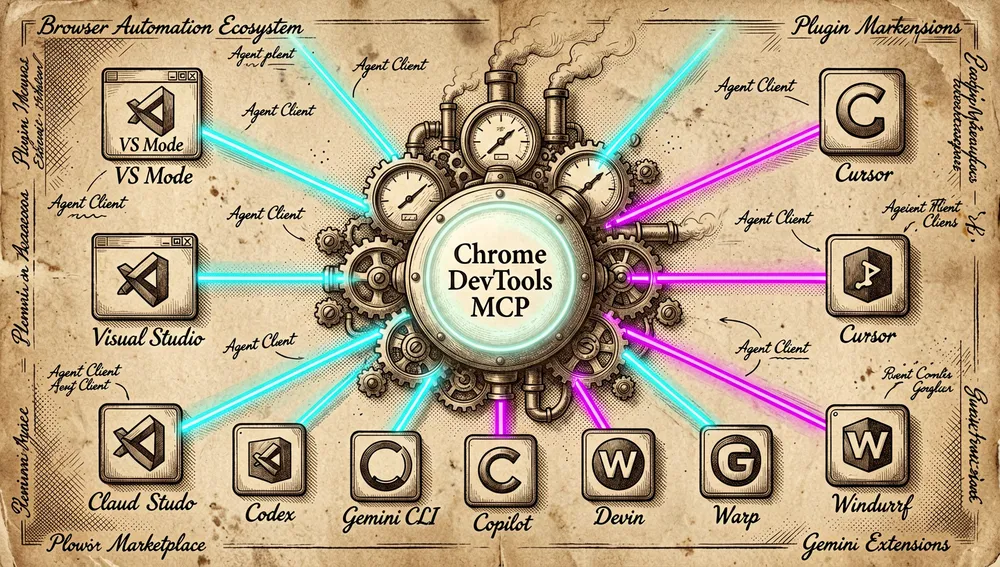
Client adoption: client-configurations.md documents configurations for a very wide list of clients: Amp, Antigravity (Google), Bob (IBM), Claude Code, Cline, Codex (OpenAI), Command Code, Copilot CLI, Copilot / VS Code, Cursor, Devin CLI, Factory CLI, Gemini CLI, Gemini Code Assist, Grok Build CLI (xAI), JetBrains AI Assistant & Junie, Kiro, Katalon Studio, Mistral Vibe, OpenCode, Qoder, Qoder CLI, Visual Studio, Warp, Windsurf. VS Code, Cursor, and Visual Studio offer one-click buttons (“Install Server” / “Install Plugin”) to add it directly.
In practice, it’s the server the DevTools team itself recommends to its users; its presence with official installers in VS Code/Cursor/Visual Studio and in the CLIs of major agents (Codex, Gemini, Copilot, Devin, Grok) signals a de facto standard status for “giving an agent browser eyes in Chrome.”
Quick-start guide
Installation and first run
Requirements: Node.js (for npx/npm) and Chrome. The package is chrome-devtools-mcp.
Option A — as an MCP server (main use case). Add to the MCP client:
{
  "mcpServers": {
    "chrome-devtools": {
      "command": "npx",
      "args": ["chrome-devtools-mcp@latest"]
    }
  }
}
To connect to an already-running browser, add --browser-url=http://127.0.0.1:9222 to args. CLI installation for some clients: Claude Code (claude mcp add chrome-devtools --scope user npx chrome-devtools-mcp@latest), Codex (codex mcp add chrome-devtools -- npx chrome-devtools-mcp@latest), Gemini CLI (gemini mcp add chrome-devtools npx chrome-devtools-mcp@latest), VS Code CLI (code --add-mcp '{"name":"io.github.ChromeDevTools/chrome-devtools-mcp","command":"npx","args":["-y","chrome-devtools-mcp"],"env":{}}').
Option B — as a plugin (MCP + skills) in Claude Code:
/plugin marketplace add ChromeDevTools/chrome-devtools-mcp
/plugin install chrome-devtools-mcp@chrome-devtools-plugins
(then restart Claude Code; verify with /skills). Documented smoke test: in the agent, run the prompt “Please check the LCP of web.dev.”
Option C — CLI (experimental). Global install:
npm i chrome-devtools-mcp@latest -g
chrome-devtools status   # check the install works
Common workflows
- Verify a live change: ask the agent “Verify in the browser that your change works as expected”; the agent uses
navigate_page+take_screenshot+ console to check. - Navigate a page (CLI):
chrome-devtools navigate_page 1 --url "https://google.com". - Take a screenshot (CLI):
chrome-devtools take_screenshot 1 --filePath screenshot.png. - Performance audit: the agent calls
performance_start_traceagainst localhost and analyzes metrics (e.g. high LCP). - Debug network/console errors: “Some images on localhost:8080 aren’t loading. What’s going on?” → the agent inspects network requests and the console.
- Debug memory (with
--memoryDebugging):get_heapsnapshot_summary→get_heapsnapshot_object_detailsto find objects retaining memory.
Essential configuration
--browser-url— connect to an already-running Chrome (vs. launching a new one). Key for reusing session/authentication.--workspace— limit file tools to specific directories (security). Not combinable with--allow-unrestricted-paths.--headless— on by default in the CLI; can be disabled to see the browser.--userDataDir— use a specific profile; if passed, disables the default isolated mode and allows reusing cookies/persistent authentication.--memoryDebugging— enables the heap-snapshot inspection tools.
Common pitfalls and fixes
- Excessive token consumption (the most repeated criticism): browser session state consumes a lot of tokens by nature. Documented/community fixes: use the CLI (more efficient), and v1.9.0 added improvements (truncated URLs in network output, DevTools-aligned trace buffer). A non-trivial behavior, not a “bug.”
- Claude Code plugin install fails with
Failed to clone repository(e.g. behind a corporate HTTPS firewall): the workaround is to use CLI installation (claude mcp add ...) instead. - Antigravity: with
--browser-urlthe server doesn’t auto-launch the browser (it connects to Antigravity’s integrated browser); you must open the browser first. - Windows 11 with Codex: requires configuring Chrome’s location and raising the startup timeout in
.codex/config.toml(startup_timeout_ms = 20_000, plusSystemRoot/PROGRAMFILESvariables). - Katalon Studio: needs an MCP proxy (
mcp-proxy --transport streamablehttp --port 8080 -- npx -y chrome-devtools-mcp@latest) because it doesn’t support direct stdio. - Multi-part/files:
upload_filesupports multiple files since v1.8.0; memory tools explicitly require the.heapsnapshot/.heaptimelineextension and the--memoryDebuggingflag.
Integrations and migration
Ready-made configuration for ~27 clients. One-click installers in VS Code, VS Code Insiders, Cursor, and Visual Studio; CLI commands for Codex, Gemini, Copilot, Devin, Grok, Factory, Qoder, Mistral Vibe, OpenCode. Works alongside vercel-labs/agent-browser (via --auto-connect); playwriter can be used as an alternative for “connecting to the existing session.” If you already automate with Playwright, DevTools MCP doesn’t replace “driving” (automation) but adds “debugging” (performance/network/memory inspection with DevTools fidelity).
Current metrics
Data from the GitHub API and the npm registry, dated September 11, 2026:
| Metric | Value |
|---|---|
| Stars | 51,654 |
| Forks | 3,631 |
| Main language | TypeScript |
| License | Apache-2.0 |
| Created | September 11, 2025 |
| Latest version (npm) | 1.9.0 |
| Latest release | chrome-devtools-mcp-v1.9.0 (September 8, 2026) |
| npm downloads (last week) | 1,426,792 |
| npm downloads (last month) | 9,555,181 |
Top contributors (GitHub API, 12 listed on the first page): OrKoN (375 contributions), dependabot[bot] (231), Lightning00Blade (139), browser-automation-bot (63), yulunz (39), szuend (27), dinfuehr (25), zyzyzyryxy (21). The GitHub API conflates issues and PRs in the open_issues_count figure, so the “open issues” total isn’t cited separately as reliable data here. Subscriber note: this article’s source didn’t record a separate subscribers_count (real watchers) figure for this repository.
Community reception
Hacker News is the main venue for discussion. The largest thread — “Chrome DevTools MCP (2025),” ID 47390817 — reached 604 points and 234 comments (created March 15, 2026; the URL pointed to the “debug your browser session” post). The original launch thread: ID 45349829 (19 points, “Chrome DevTools MCP,” September 23, 2025).
Concrete praise:
- paulirish (DevTools team): “DevTools MCP and its new CLI are maintained by the team behind Chrome DevTools & Puppeteer and definitely have a more complete feature set. I’d expect it to be more reliable.”
- boomskats: “I’ve been using it for a while, mostly with codex over opencode. It’s more reliable and token-efficient than other devtools protocol MCPs I’ve tried. My favorite unexpected use case was telling gemini to use it as an SVG editing REPL… it also works great with electron apps.”
- NiekvdMaas: “Also works well alongside agent-browser (vercel-labs/agent-browser) using —auto-connect.”
- speedgoose values that the MCP API “can be useful for humans too” and that it’s friendlier than the previous devtools API.
- zxspectrumk48 and dataviz1000 share success stories (re-engineering APIs, intercepting requests).
Concrete criticism:
- glerk: “Keep in mind it’s a massive token hog if you’re paying for your own tokens!”
- rossvc: “I’ve been using DevTools MCP for months but it’s extremely token-heavy. Is there an alternative that gives the same amount of detail when reading network requests?”
- nerdsniper (in response): “It’s probably not fully optimized… but browser state/session data is always going to eat a ton of tokens because it’s a ton of data. There’s really no way around it.”
- tonyhschu: “I do something similar with Playwright. It used to be a real token hog and got expensive fast. So much so that I built a wrapper to dump results to disk first.”
- mmaunder (controversy): “Google is way behind on agentic coding CLI. Gemini CLI is terrible… Also MCP is quite dead, as anyone doing heavy agentic coding knows.” → rsalus responds that “MCP is far from dead… centralized remote MCP servers are incredibly useful,” and zeroxfe counters “this is far from the truth” for large enterprise environments. cheema33 argues MCP “makes you pay in token usage even when you’re not using the server,” versus Agent Skills with “progressive disclosure.”
- esperent: asks whether this is the same as “Claude in Chrome” and raises a security concern about the agent seeing your data.
Neutral summary: reception is very positive on reliability and quality (largely because it’s the product of the Chrome/Puppeteer team itself), but the recurring, well-documented friction point is token consumption, which several users describe as “extreme” and which the team itself acknowledges as inherent to the data volume of a browser session — hence the interest in the CLI as a more token-efficient path.
Comparison with similar projects
| Project | Stars | Focus | Key difference |
|---|---|---|---|
| ChromeDevTools/chrome-devtools-mcp | 51,654 | MCP server + Chrome debugging CLI | Official from the Chrome/Puppeteer team; connects to existing Chrome; strong in traces, network, memory |
| microsoft/playwright-mcp | 37,013 | MCP server over Playwright | Playwright-based (multi-browser); automation more than debugging |
| vercel-labs/agent-browser | 42,416 | Automation CLI for agents | Vercel’s CLI; compatible via --auto-connect with DevTools MCP |
| remorses/playwriter | 3,879 | Extension + CLI to control your browser | Runs Playwright snippets in a stateful session; extension |
| browser-use/browser-use | 114,202 | Agent framework that uses the browser | Full framework/agents, not just a debugging MCP server |
playwright-mcp is the most direct competitor in “MCP that controls a browser” (Playwright instead of direct CDP), while browser-use is a higher category (a browser-using agent framework, with much greater star adoption but a different purpose). DevTools MCP differentiates itself by being Chrome’s native debugging tool (performance traces, heap snapshots, console, network with DevTools fidelity) and by connecting to your existing session instead of launching an isolated browser. Hacker News contrasts them explicitly: “Playwright vs. Chrome DevTools MCP: Driving vs. Debugging” — Playwright “drives” (automates) while DevTools MCP “debugs” (inspects at runtime).
How to contribute
The repository documents a contribution process in CONTRIBUTING.md (~6,500 characters). Flow: standard GitHub fork, branches, pull request; the team asks that contributors follow the design principles (design-principles.md) when adding functionality. Documentation is split into individual files (a change made in v1.9.0), organized under docs/ (tool-reference, configuration, cli, advanced-usage, client-configurations, troubleshooting, design-principles). When adding a new client configuration, contributors are asked to add it in alphabetical order in client-configurations.md. The team states it builds the project “incrementally” and asks for community feedback. The agents.md update for testing (v1.9.0) and the presence of a browser-automation-bot among top contributors suggest the pipeline itself uses browser-automation agents.
Use cases
- Frontend/fullstack developers using AI agents (Claude Code, Codex, Gemini CLI, Copilot): the central case. They let the agent see the result in the browser and self-correct.
- Performance / Core Web Vitals teams:
performance_start_trace+ LCP analysis enables automated performance audits with DevTools fidelity and buffering. - Memory-leak debuggers: the heap-snapshot suite with
--memoryDebuggingprovides an uncommon way to inspect memory retention directly from an agent, useful in SPAs/Electron apps. - QA / test automation: navigation, form filling, clicks, and screenshots, along with multi-file
upload_fileand PWA tools. - Electron/web desktop app engineers:
boomskatsdocuments successful reverse-engineering and extending of Electron apps. - Creative/unexpected use cases: the agent as an “SVG editing REPL” to generate icons through screenshot iteration.
- Teams already using Chrome as their working browser: connecting to the existing session preserves authentication and cookies.
- Users paying for their own tokens: should weigh the documented “token hog” behavior; the CLI and v1.9.0 improvements mitigate (but don’t eliminate) the cost.
Resources
- Repository: https://github.com/ChromeDevTools/chrome-devtools-mcp
- Official blog (launch): https://developer.chrome.com/blog/chrome-devtools-mcp
- Official blog (debug your session): https://developer.chrome.com/blog/chrome-devtools-mcp-debug-your-browser-session
- Official skills/plugins:
/plugin marketplace add ChromeDevTools/chrome-devtools-mcp; Gemini extensiongemini extensions install --auto-update https://github.com/ChromeDevTools/chrome-devtools-mcp - npm registry: https://www.npmjs.com/package/chrome-devtools-mcp
- Changelog: https://github.com/ChromeDevTools/chrome-devtools-mcp/blob/main/CHANGELOG.md
- Main HN thread: https://news.ycombinator.com/item?id=47390817 (604 pts, 234 comments)
- Launch thread: https://news.ycombinator.com/item?id=45349829
- Related projects:
vercel-labs/agent-browser(42,416 ★),remorses/playwriter(3,879 ★),microsoft/playwright-mcp(37,013 ★),browser-use/browser-use(114,202 ★),ScriptedAlchemy/devtools-debugger-mcp(347 ★),pasky/chrome-cdp-skill
Note: this report combines the README and repository files, the GitHub API, the npm registry, Hacker News (Algolia), and the official developer.chrome.com blog, consulted on September 11, 2026. Figures change over time. No verified Reddit threads could be retrieved in this research (the API blocked the query), so no Reddit references are cited to avoid inventing sources.
Comments